The BBC has compiled a very interesting set of statistical charts combined with key event dates, giving a better idea of their impact on the statistics.
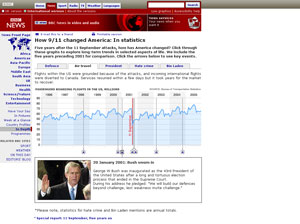

It is nicely presented and works well with the key dates, accompanied each time with an image and brief description. An interesting choice of statistics indicating which areas have dramatically changed due to 9/11.